Happy New Year 2026 to all our members and visitors! Our Forum is Now Back Online After Some Critical Upgrade- We Apologize for the inaccessibility Period! Thank You all. CORONAVIRUS safety tips from Admin! 1. Watch your hands with running water 2. Dont cough in your hands 3. Keep distance from people 4. Stay indoor if neccessary!! Stay safe !!! Dear Members,Do you know that naijacrux is fully programmed to serve you better, Do you know that you can share your favorite post on naijacrux with friends on twitter,facebook, googleplus,myspace and many more! To share post on naijacrux with friends and family on twitter, facebook,googleplus,myspace,and many more, scroll to the down page of the post, Click on the Social Icon You Want To Share On To Share.


Author Topic: InstaForex - instaforex.com  (Read 573821 times)

0 Members and 1 Guest are viewing this topic.

Offline Instaforexbuk

  • Sr. Member
  • ****
  • Posts: 436
  • Karma: +0/-0
Re: InstaForex - instaforex.com
« Reply #90 on: January 25, 2017, 02:16:22 PM »
Advertisement
Technical analysis of gold for January 25, 2017

Gold weakness came as we expected but there is still no confirmation that the short-term top is in. A break below $1,195-97 will confirm the correction has started. Gold is expected to reach at least $1,180 as a pullback and retracement of the rise from $1,122.


Blue line - bearish divergence Gold price is testing Ichimoku cloud support. A break below short-term support of $1,195-97 will result in a deeper pullback towards $1,180 where we find the 38% Fibonacci retracement of the entire rise from $1,122. Resistance is at $1,220 and a new high, if it comes, is expected to be faded.


Gold price is showing rejection signs at the lower cloud boundary as we expected for so long. This rejection is expected to push price towards $1,180 or even $1,160 before the next big move up starts.

Read more: https://www.instaforex.com/forex_analysis/87213
]Best Regards,
PR Manager
InstaForex Companies Group
http://www.instaforex.com[/b]
My Webpage
 

Offline Instaforexbuk

  • Sr. Member
  • ****
  • Posts: 436
  • Karma: +0/-0
Re: InstaForex - instaforex.com
« Reply #91 on: January 26, 2017, 03:23:11 PM »
EUR/USD remain bearish

We remain bearish below strong resistance at 1.0773 (Fibonacci projection, Fibonacci retracement) for a push down to 1.0682 (Fibonacci retracement, Fibonacci projection, horizontal pullback support).

Stochastic (55,5,3) still has good downside potential for its drop.

Sell below 1.0773. Stop loss at 1.0803. Take profit at 1.0682.


Read more: https://www.instaforex.com/forex_analysis/87313
]Best Regards,
PR Manager
InstaForex Companies Group
http://www.instaforex.com[/b]
My Webpage
 

Offline Instaforexbuk

  • Sr. Member
  • ****
  • Posts: 436
  • Karma: +0/-0
Re: InstaForex - instaforex.com
« Reply #92 on: January 27, 2017, 03:32:26 PM »
Technical analysis of USD/CAD for January 27, 2017

General overview for 27/01/2017:

 The market has bounced from the level of 1.3053 and now is trying to get back to the golden channel. The main hurdle to overcome is the overbalance at the level of 1.3141. Only if this level is clearly violated, the market can break out of the channel and head upward towards the level of 1.3213. Without breaking above this level, the market might threaten to test the intraday support again and even move lower towards the local low at the level of 1.3017.

Support/Resistance:

 1.3017 - Technical Support

1.3053 - Intraday Support

1.3137 - WS1

1.3141 - Overbalance Level

1.3213 - Intraday Resistance

1.3261 - Weekly Pivot

1.3507 - WR1

Trading recommendations: Day traders could add to their opened buy orders only if the level of 1.3131 is clearly violated (hourly candle close above this level). SL should be placed below the swing low at the level of 1.3016 and TP should be left open for now.


Read more: https://www.instaforex.com/forex_analysis/87343
]Best Regards,
PR Manager
InstaForex Companies Group
http://www.instaforex.com[/b]
My Webpage
 

Offline Instaforexbuk

  • Sr. Member
  • ****
  • Posts: 436
  • Karma: +0/-0
Re: InstaForex - instaforex.com
« Reply #93 on: January 30, 2017, 10:53:11 AM »
NZD/USD Intraday technical levels and trading recommendations for January 30, 2017


On November 8, significant signs of a bearish reversal were expressed around the upper limit of the depicted consolidation range (0.7350). A bearish breakdown of 0.7250 (the lower limit of the depicted range) enhanced the bearish side of the market toward the price level of 0.7100 (recent bottom of October 28) which was broken as well. Bearish persistence below 0.7100 allowed a quick decline toward 0.6960 (BUY zone) where bullish rejection and a valid BUY entry were expected. All T/P levels were successfully achieved. Once again, bearish persistence below the price level of 0.7100 enabled the NZD/USD pair to pursue toward lower target levels around 0.6990 (the upper limit of the depicted BUY zone). The price level of 0.6990 failed to apply enough bullish pressure. Instead of that, bearish movement continued toward the lower limit of the depicted BUY zone (0.6860) which provided significant bullish rejection on December 23. The NZD/USD pair was trapped within the depicted price range (0.6860-0.6990) until a bullish breakout occurred. A bullish breakout above 0.7000 allowed the pair to head toward the price level of 0.7100 (Key-Level) which failed to provide sufficient bearish pressure on the pair. Bullish persistence above 0.7100 allowed further bullish advance toward 0.7250-0.7300 (Sell-Zone) where a valid SELL entry can be offered if enough bearish pressure is maintained (Note the bearish engulfing daily candlestick of Thursday).

Read more: https://www.instaforex.com/forex_analysis/87395
]Best Regards,
PR Manager
InstaForex Companies Group
http://www.instaforex.com[/b]
My Webpage
 

Offline Instaforexbuk

  • Sr. Member
  • ****
  • Posts: 436
  • Karma: +0/-0
Re: InstaForex - instaforex.com
« Reply #94 on: January 31, 2017, 04:34:55 PM »
Intraday technical levels and trading recommendations for EUR/USD for January 31, 2017


In January 2015, the EUR/USD pair moved below the major demand levels near 1.2100 where historical bottoms were previously set in July 2012 and June 2010. Hence, a long-term bearish target was projected toward 0.9450. In March 2015, EUR/USD bears challenged the monthly demand level around 1.0570, which had been previously reached in August 1997. Later in April 2015, a strong bullish recovery was observed around the mentioned demand level. However, next monthly candlesticks (September, October, and November) reflected a strong bearish rejection around the area of 1.1400-1.1500. In the longer term, the level of 0.9450 remains a projected target if the current monthly candlestick achieves bearish closure below the depicted monthly demand level of 1.0570.


The long-term outlook for the EUR/USD pair remains bearish as the monthly chart illustrates. Bearish persistence below 1.0575 is needed to pursue this bearish scenario. In September 2016, temporary bullish breakout above 1.1250 was expressed again, but evident bearish pressure was applied on the EUR/USD pair on September 16. Closure below 1.1250 (Supply level 1) enhanced the bearish momentum toward the price level of 1.1000 (Key-Level 1). Bearish persistence below 1.0825 (Key-Level 2) allowed further decline toward 1.0570 (demand level) where evident bullish rejection was expressed on November 24. Shortly after, the Fibonacci Expansion 100% (1.0825) constituted a recent supply level which offered a valid SELL entry on December 8. Bearish persistence below the depicted demand level (1.0570) was expected to allow further decline toward 1.0220. However, significant bullish recovery was expressed around the price level of 1.0340 on January 3. Bullish persistence above 1.0600 allows further bullish advance toward 1.0825-1.0850 (Fibonacci Expansion 100%) where bearish rejection and a valid SELL entry can be anticipated. Bullish breakout above 1.0570-1.0600 was executed on January 12. Hence, the price level of 1.0600 now constitutes a recent demand level to be watched for bullish rejection if any bearish pullback occurs.

Read more: https://www.instaforex.com/forex_analysis/87471
]Best Regards,
PR Manager
InstaForex Companies Group
http://www.instaforex.com[/b]
My Webpage
 

Offline Instaforexbuk

  • Sr. Member
  • ****
  • Posts: 436
  • Karma: +0/-0
Re: InstaForex - instaforex.com
« Reply #95 on: February 01, 2017, 05:08:47 PM »
Intraday technical levels and trading recommendations for GBP/USD for February 1, 2017


By the end of June a significant bearish break below 1.3550 was expressed as seen on the depicted charts (Fundamental Reasons). Bearish persistence below the demand level at 1.3550 enhanced the bearish scenario toward the price levels around 1.2700 (Bearish projection target). The GBP/USD pair has been trapped inside the depicted consolidation range (above 1.2700) until a bearish breakout took place on October 6. Daily persistence below 1.2700 confirmed the bearish Flag pattern. That is why, a bearish projection target was expected near 1.2020. On October 25, Bullish recovery was initiated around the price level of 1.2080. That is why, a bullish pullback was executed toward 1.2700-1.2750. Risky traders considered this bullish pullback toward the price zone of 1.2700-1.2750 to be a valid SELL entry. All T/P levels were successfully reached. On January 16, a bullish engulfing candlestick was expressed around the demand level of 1.2000. That's why, another bullish breakout above 1.2430 was initiated. The next bullish target is located around 1.2750 where bearish rejection should be expected. On the other hand, the next bearish destination would be located around 1.1200 when bearish momentum is resumed.

Read more: https://www.instaforex.com/forex_analysis/87505
]Best Regards,
PR Manager
InstaForex Companies Group
http://www.instaforex.com[/b]
My Webpage
 

Offline Instaforexbuk

  • Sr. Member
  • ****
  • Posts: 436
  • Karma: +0/-0
Re: InstaForex - instaforex.com
« Reply #96 on: February 02, 2017, 05:31:21 PM »
Will GBP hit the 1.2800 mark?

GBP has been gaining rapidly against USD and its trend has been quite intact up to now. Britain's Brexit still influence the volatility in the market where guidelines for Brexit are being processed. Moreover, it is also ensured that the UK will leave the Eurozone and will discuss the free trade policies with the Eurozone leaders again. It would be interesting to see the way Trump trying to make America great again. At the same time Britain's Brexit process is going to affect the currency in the long run. Today is an important day for GBP, as such news reports as Inflation report, Monetary policy summary, and Official bank rate due to publish today. Though all the forecasts are not predicting any changes in the figure, high volatility is expected to hit the market today before and during the news event.

Now let us take a look at the technical point of view. GBP has gained aggressively by bouncing off the support level of 1.2410 area. Recently the market has bounced off from the support area residing between 1.2515 and 1.2550 area and currently is climbing towards the resistance area 1.2730 to 1.2800. Due to a considerable number of important news releases, the market is expected to be volatile while trying to reach the resistance area between 1.2730 and 1.2800. On the other hand, if the market fails to hit the resistance and reverses downwards, we might see some corrective structures taking place before the NFP report.


Read more: https://www.instaforex.com/forex_analysis/87576
]Best Regards,
PR Manager
InstaForex Companies Group
http://www.instaforex.com[/b]
My Webpage
 

Offline Instaforexbuk

  • Sr. Member
  • ****
  • Posts: 436
  • Karma: +0/-0
Re: InstaForex - instaforex.com
« Reply #97 on: February 03, 2017, 05:16:27 PM »
Technical analysis of NZD/USD for February 03, 2017


Overview:

The NZD/USD pair broke resistance that has turned into strong support at the level of 0.7238 this week. Today the level of 0.7238 is expected to act as major support. From this point, we expect the NZD/USD pair to continue moving in a bullish trend from the support levels of 0.7265 and 0.7238. Currently, the price is moving in a bullish channel. This is confirmed by the RSI indicator signaling that we are still in the bullish trending market. Consequently, the first support is set at the level of 0.7265. So, the market is likely to show signs of a bullish trend around the spot of 0.7265 - 0.7265. In other words, buy orders are recommended above the spot of 0.7265 - 0.7265 with the first target at the level of 0.7302; and continue towards 0.7349 (the double top). This would suggest a bearish market because the moving average (100) is still in a positive area and does not show any trend-reversal signs at the moment. On the other hand, if the NZD/USD pair fails to break through the resistance level of 0.7349, the market will decline further to 0.7300. The pair is expected to drop lower towards at least 0.7265 with a view to test the weekly pivot point. Also, it should be noted that the weekly pivot point will act as key level today. According to the previous events, we expect the NZD/USD pair to trade between 0.7238 and 0.7349.

Read more: https://www.instaforex.com/forex_analysis/87613
]Best Regards,
PR Manager
InstaForex Companies Group
http://www.instaforex.com[/b]
My Webpage
 

Offline Instaforexbuk

  • Sr. Member
  • ****
  • Posts: 436
  • Karma: +0/-0
Re: InstaForex - instaforex.com
« Reply #98 on: February 06, 2017, 04:28:53 PM »
Technical analysis of EUR/JPY for Febuary 6, 2017

General overview for 06/02/2017:

 The corrective cycle continues after a failed impulsive wave development that ended only in three waves. The current wave structure looks like a complex WXYXXZ pattern and it is about to complete. The first projected level for wave c of wave Z (brown) is at the level of 120.52. If the wave Z (brown) is completed there, then the whole correction in wave (4) (blue) will be completed as well, so the last wave to the upside, wave 5 (blue) might start to unfold at last.

Support/Resistance:

123.84. - WR2

 123.30 - Wave XX Top

122.51 - Intraday Resistance

122.41 - WR1

121.70 - Weekly Pivot

 121.01 - Intraday Support

120.52 - Technical Support

 Trading recommendations: Day traders should consider opening sell order from current levels with SL above the level of 121.01 and TP at the level of 120.52.


Read more: https://www.instaforex.com/forex_analysis/87673
]Best Regards,
PR Manager
InstaForex Companies Group
http://www.instaforex.com[/b]
My Webpage
 

Offline Instaforexbuk

  • Sr. Member
  • ****
  • Posts: 436
  • Karma: +0/-0
Re: InstaForex - instaforex.com
« Reply #99 on: February 07, 2017, 03:57:54 PM »
Technical analysis of USD/CAD for Febuary 7, 2017

General overview for 07/02/2017:

The overbalance level at 1.3101 had been easily broken and now the price is going vertically upward, which is a typical behavior for wave three. The next target for the bulls is at 61%Fibo at the level of 1.3227 and in a case of an extension, there is still next resistance at the level of 1.3297. This scenario is invalidated only when the top of the wave -i- at the level of 1.3101 is clearly violated.

Support/Resistance:

1.2925 - WS1

1.2967 - Technical Support

1.3050 - Weekly Pivot

1.3125 - WR1

1.3136 - Intraday Support

1.3227 - 61%Fibo

1.3246 - WR2

1.3297 - 78%Fibo

 Trading recommendations: All buy order from yesterday should move TP to the level of 1.3227 or to the level of 1.3297.


Read more: https://www.instaforex.com/forex_analysis/87723
]Best Regards,
PR Manager
InstaForex Companies Group
http://www.instaforex.com[/b]
My Webpage
 

Offline Instaforexbuk

  • Sr. Member
  • ****
  • Posts: 436
  • Karma: +0/-0
Re: InstaForex - instaforex.com
« Reply #100 on: February 08, 2017, 05:09:37 PM »
GBP/USD reaches profit target and turns bearish


The price has bounced and reached our yesterday's profit target. We turn bearish below 1.2546 resistance (Fibonacci retracement, horizontal overlap resistance) for a push down to 1.2356 support (Fibonacci retracement, Fibonacci projection, swing low support).

RSI (34) is seeing strong descending resistance holding the price on the downside.

Sell below 1.2546. Set stop loss at 1.2632 and take profit at 1.2356.


Read more: https://www.instaforex.com/forex_analysis/87808
]Best Regards,
PR Manager
InstaForex Companies Group
http://www.instaforex.com[/b]
My Webpage
 

Offline Instaforexbuk

  • Sr. Member
  • ****
  • Posts: 436
  • Karma: +0/-0
Re: InstaForex - instaforex.com
« Reply #101 on: February 09, 2017, 05:07:50 PM »
Elliott wave analysis of EUR/JPY for February 09, 2017


Wave summary:

We saw a stab lower, but only to 119.30, before turning higher again. However, as long as minor resistance at 120.13 is able to cap the upside, we could still see one more stab lower to 119.14 to complete wave (iv) and set the stage for wave (v) higher towards 126.54. That said, a direct break above 120.13 will indicate that wave (iv) is complete, while a break above resistance at 120.71 will confirm the low is in place for a new impulsive rally higher.

 R3: 120.71

R2: 120.23

R1: 120.13

Pivot: 119.80

S1: 119.48

S2: 119.30

S3: 119.14

Trading recommendation: We will buy EUR at 119.25 or upon a break above 120.13.

Read more: https://www.instaforex.com/forex_analysis/87836
]Best Regards,
PR Manager
InstaForex Companies Group
http://www.instaforex.com[/b]
My Webpage
 

Offline Instaforexbuk

  • Sr. Member
  • ****
  • Posts: 436
  • Karma: +0/-0
Re: InstaForex - instaforex.com
« Reply #102 on: February 10, 2017, 04:55:47 PM »
Technical analysis of GBP/JPY for Feburary 10, 2017
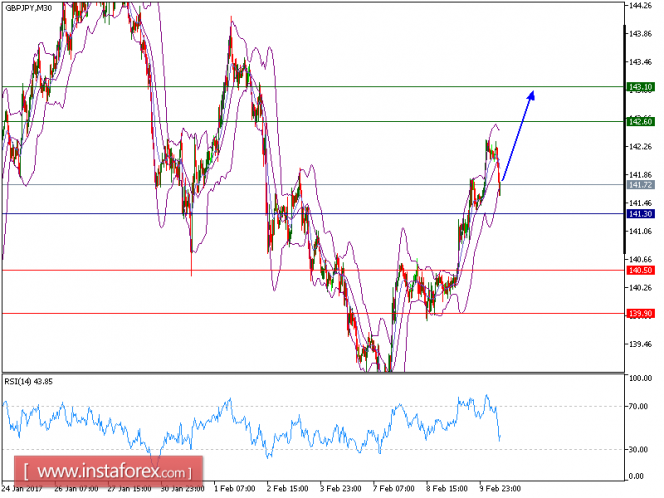


GBP/JPY is expected to move further upside. The pair has continued its rebound since the low, which was hit on February 7, and is likely to continue its upleg. The 20-period moving average is currently playing a key support role, while the 50-period moving average is also rising and confirming a bullish bias. Meanwhile, the relative strength index is above its neutrality area at 50 and is positively oriented. As long as the level of 141.30 is not broken down, further bounce is preferred with 142.60 and 143.10 as targets.

The pair is trading above its pivot point. It is likely to trade in a wider range as long as it remains above its pivot point. Therefore, long positions are recommended with the first target at 142.60 and the second one at 143.10. In the alternative scenario, short positions are recommended with the first target at 140.50, if the price moves below its pivot points. A break of this target is likely to push the pair further downwards, and one may expect the second target at 139.90. The pivot point is at 141.30.

Resistance levels: 142.60, 143.10, and 143.75

Support levels: 140.50,139.90, and 139.45

Read more: https://www.instaforex.com/forex_analysis/87900
]Best Regards,
PR Manager
InstaForex Companies Group
http://www.instaforex.com[/b]
My Webpage
 

Offline Instaforexbuk

  • Sr. Member
  • ****
  • Posts: 436
  • Karma: +0/-0
Re: InstaForex - instaforex.com
« Reply #103 on: February 13, 2017, 05:11:03 PM »
Elliott wave analysis of EUR/JPY for February 13, 2017


Wave summary:

 We continue to look for more upside pressure toward the ideal target seen at 126.54 to complete wave 3. A short-term break above minor resistance seen at 121.33 and more importantly a break above resistance at 121.77 will confirm the expected rally higher to 124.09 on the way higher to 126.54 from where a more sustained consolidation is expected. Support is now seen at 120.22.

R3: 122.52

R2: 121.77

R1: 121.23

 Pivot: 120.90

S1: 120.66

S2: 120.22

S3: 120.08

Trading recommendation: We are long EUR at 120.15 with stop placed at 119.90. Take profit is placed at 126.25.

Read more: https://www.instaforex.com/forex_analysis/87958
]Best Regards,
PR Manager
InstaForex Companies Group
http://www.instaforex.com[/b]
My Webpage
 

Offline Instaforexbuk

  • Sr. Member
  • ****
  • Posts: 436
  • Karma: +0/-0
Re: InstaForex - instaforex.com
« Reply #104 on: February 14, 2017, 05:29:19 PM »
Daily analysis of EUR/JPY for February 14, 2017


Overview

The EUR/JPY pair returned to provide new bearish trading below 120.60 level, to confirm its affection by the bearish bias domination in the upcoming trading, and the moving average 55 decline to 121.20 level. It forms new resistance which increases the negative pressure on the upcoming trading, to wait for recording the targets at 120.00 reaching to 118.60 level. Stochastic's sharp decline to the oversold level supports the negative suggestion for the upcoming trading, providing extra negative momentum that allows the price to record the targets in the near and medium trading. The expected trading range for today is between 120.80 and 118.60.

Read more: https://www.instaforex.com/forex_analysis/88065
]Best Regards,
PR Manager
InstaForex Companies Group
http://www.instaforex.com[/b]
My Webpage
 

Offline Instaforexbuk

  • Sr. Member
  • ****
  • Posts: 436
  • Karma: +0/-0
Re: InstaForex - instaforex.com
« Reply #105 on: February 15, 2017, 05:11:08 PM »
Global macro overview for 15/02/2017

Interesting remarks from Bank of Japan Governor Haruhiko Kuroda has hit the newswires during his speech at Japanese Parliment today. He stated, that BoJ policy is still aimed at 2% target and is not aiming at Forex exchange levels of Japanese Yen as exchange levels are affected by various factors, not only interest rate difference. BoJ still has a long way to hit price target, but BoJ is ready to continue powerful easing. BoJ policymakers are not thinking about raising target rates at the moment. In conclusion, it is a clear reiteration of his previous remarks regarding the inflation target and a possible intervention from BoJ.


 Let's now take a look at the USD/JPY technical picture at the H4 time frame. The bulls have managed to break out above the level of 114.16 and now it will act as an intraday support. The next target for bulls is the technical resistance at the level of 115.60, but first to 50%Fibo at the level of 115.06 must be violated. Please notice that the market conditions starting to look overbought at this time frame, so the corrective cycle is due soon.


Read more: https://www.instaforex.com/forex_analysis/88095
]Best Regards,
PR Manager
InstaForex Companies Group
http://www.instaforex.com[/b]
My Webpage
 

Offline Instaforexbuk

  • Sr. Member
  • ****
  • Posts: 436
  • Karma: +0/-0
Re: InstaForex - instaforex.com
« Reply #106 on: February 27, 2017, 04:56:03 PM »
EUR/USD Fundamental Analysis February 27, 2017

EUR/USD is currently residing just over the support area of 1.0525-50 after some bearish pressure on Friday. Today EUR had some positive results on Economical events like Spanish Flash CPI which came out as 3.0% which was expected to be 3.3%, M3 Money Supply which was equal to the forecast 4.9% but Private Loans is seen to increase by 0.1% at 2.2% which was forecasted to be 2.1%. Today USD also have some important high impact economic event Core Durable Goods Orders which is forecasted to remain same as previous at 0.5% and Pending Home Sales is forecasted to decrease from 1.6% to 1.1%. If USD fails to provide some good economy data today EUR is said to gain more strength in the coming days.

Now let us look at the technical view, price has bounced off from the support area between 1.0525-50 and despite the bearish pressure on Friday, bias is still bullish. If the price remains above the support area it is expected that the price will hit the nearest resistance at 1.0640-50 area and if that resistance is also taken out due to heavy bullish pressure 1.08 will be the ultimate resistance to target upside. On the other hand, if the price breaks below the support area 1.0525 then we might see much more downwards movement.


Read more: https://www.instaforex.com/forex_analysis/88613
]Best Regards,
PR Manager
InstaForex Companies Group
http://www.instaforex.com[/b]
My Webpage
 

Offline Instaforexbuk

  • Sr. Member
  • ****
  • Posts: 436
  • Karma: +0/-0
Re: InstaForex - instaforex.com
« Reply #107 on: February 28, 2017, 05:05:42 PM »
EUR/USD analysis for February 28, 2017


Recently, the EUR/USD pair has been trading upwards. The price tested the level 1.0605. According to the 1H time frame, I found broken downward trendline in the background and successful changing in trend dynamic from bearish to bullish. The price is making higher highs and higher lows, which is good sign of strength. My advice is to watch for potential buying opportunties. The first target is set at the price of 1.0675.

Resistance levels:

R1: 1.0630

 R2: 1.0675

R3: 1.0715

Support levels:

S1: 1.0545

S2: 1.0505

S3: 1.0465

Trading recommendations for today: watch for potential buying opportunities.

Read more: https://www.instaforex.com/forex_analysis/88669
]Best Regards,
PR Manager
InstaForex Companies Group
http://www.instaforex.com[/b]
My Webpage
 

Offline Instaforexbuk

  • Sr. Member
  • ****
  • Posts: 436
  • Karma: +0/-0
Re: InstaForex - instaforex.com
« Reply #108 on: March 01, 2017, 04:36:14 PM »
Technical analysis of NZD/USD for March 01, 2017


NZD/USD is under pressure. The pair retreated from the key resistance at 0.7175 and broke below its 20-period and 50-period moving averages. Additionally, the 20-period moving average is turning down. The relative strength index is bearish, calling for a further decline. Therefore, below 0.7175 expect a new drop to 0.7100 and even to 0.7075 in extension. The pair is trading below its pivot point. It is likely to trade in a lower range as long as it remains below the pivot point. Short positions are recommended with the first target at 0.7100. A break below this target will move the pair further downwards to 0.7075. The pivot point stands at 0.7175. If the price moves in the opposite direction and bounces back from the support level, it will move above its pivot point. It is likely to move further to the upside. According to that scenario, long positions are recommended with the first target at 0.7205 and the second one at 0.7235.

Resistance levels: 0.7205, 0.7230, and 0.7280

Support levels: 0.7100, 0.7075, and 0.7030

Read more: https://www.instaforex.com/forex_analysis/88723
]Best Regards,
PR Manager
InstaForex Companies Group
http://www.instaforex.com[/b]
My Webpage
 

Offline Instaforexbuk

  • Sr. Member
  • ****
  • Posts: 436
  • Karma: +0/-0
Re: InstaForex - instaforex.com
« Reply #109 on: March 02, 2017, 05:31:25 PM »
Global macro overview for 02/03/2017

The President Trump's first address before the joint session of Congress yesterday had been largely positive amongst the market participants, however, his speech again failed to provide solid direction for investors. Trump mainly reiterated his campaign promises when he had called for over $1Trillion investment in infrastructure, intentions to replace Obamacare and again pledged massive tax relief for the middle class. In the result, the stock made new all-time highs as global investors still believe the promises made by Trump despite any specific actions towards promises fulfillment. The global equity rally goes on and it reminds me one of the oldest investment saying: buy the rumor, sell the news. Anyway, time will tell.

Let's now take a look at SP500 ETF (called SPY) technical picture at the H4 time frame. The bulls have managed to make another all-time high at the level of 240.22, but there is still an unfilled gap at the level of 237.29. This level will now act as a technical support for the price and another higher low might be made around this level. Only a sustained break out below the level of 235.17 would indicate a larger corrective cycle coming on, otherwise the outlook remains bullish.


Read more: https://www.instaforex.com/forex_analysis/88789
]Best Regards,
PR Manager
InstaForex Companies Group
http://www.instaforex.com[/b]
My Webpage
 

Offline Instaforexbuk

  • Sr. Member
  • ****
  • Posts: 436
  • Karma: +0/-0
Re: InstaForex - instaforex.com
« Reply #110 on: March 03, 2017, 03:54:29 PM »
Technical analysis of USDX for March 3, 2017

The Dollar index remains in a bullish trend and has broken above 102. Today's close is very important. If the bulls manage to keep hold of the trend, then we can say that at 99.25 we see an important medium-term low. Target remains at 105-110.


Blue lines - bullish channel

 The Dollar index is making higher highs and higher lows. There are bearish divergence signs in the 4-hour chart shown above. Short-term support is at 101.50 and resistance at 103. Trend will change on a break below 101.10.


Black line - neckline support

Green line - long-term support trend line

The weekly chart remains bullish as the price is trying to break above the tenkan-sen (Red line indicator). Weekly support is at 100.70. Next weekly resistance is at 103.70. It is crucial to see where this week closes. So far the bulls remain in control.

Read more: https://www.instaforex.com/forex_analysis/88839
]Best Regards,
PR Manager
InstaForex Companies Group
http://www.instaforex.com[/b]
My Webpage
 

Offline Instaforexbuk

  • Sr. Member
  • ****
  • Posts: 436
  • Karma: +0/-0
Re: InstaForex - instaforex.com
« Reply #111 on: March 06, 2017, 04:23:13 PM »
Technical analysis of USD/CHF for March 06, 2017


USD/CHF is under pressure. The pair is trading below its declining 20-period and 50-period moving averages, which play resistance roles and maintain the downside bias. The relative strength index is below its neutrality level at 50 and lacks upward momentum. Federal Reserve Chairwoman Janet Yellen pointed out that an interest rate increase this month would be appropriate and that rates are likely to rise faster this year. Meanwhile, Federal Reserve Vice Chairman Stanley Fischer also said that a rate increase was justified by a run of consistently solid economic data. On the economic data front, the ISM non-manufacturing composite index improved to 57.6 in February (vs. 56.5 expected) from 56.5 January. To conclude, as long as 1.0135 is not surpassed, look for a further drop to 1.0060 and 1.0040 in extension.

Resistance levels: 1.0150, 1.0165, and 1.0185

Support levels: 1.0060, 1.0040, and 1.000

Read more: https://www.instaforex.com/forex_analysis/88895
]Best Regards,
PR Manager
InstaForex Companies Group
http://www.instaforex.com[/b]
My Webpage
 

Offline Instaforexbuk

  • Sr. Member
  • ****
  • Posts: 436
  • Karma: +0/-0
Re: InstaForex - instaforex.com
« Reply #112 on: March 07, 2017, 05:03:18 PM »
GBP/USD analysis for March 07, 2017


Recently, the GBP/USD pair has been trading downwards. The price tested the level of 1.2183. According to the 4H time frame, I found that sellers are in control. My advice is to watch for potential selling opportunities. Targets are set at the price of 1.2124 and at the price of 1.2000. The short-term trend is downward. Fibonacci pivot points >

Resistance levels:

R1: 1.2283

 R2: 1.2300

R3: 1.2330

Support levels:

 S1: 1.2225

S2: 1.2205

S3: 1.2175

Trading recommendations for today: watch for potential selling opportunities.

Read more: https://www.instaforex.com/forex_analysis/88945
]Best Regards,
PR Manager
InstaForex Companies Group
http://www.instaforex.com[/b]
My Webpage
 

Offline Instaforexbuk

  • Sr. Member
  • ****
  • Posts: 436
  • Karma: +0/-0
Re: InstaForex - instaforex.com
« Reply #113 on: March 08, 2017, 05:05:38 PM »
Daily analysis of Silver for March 08, 2017


Overview

Silver price reached our expected target at $17.43 and settles near it. The price on the chart is accompanied by stochastic, so silver has entered the oversold area. It supports the chance for bouncing higher to resume the main bullish trend. Now the price is waiting for testing $18.30 initially. Therefore, we expect silver to trade higher in the short term. Please note that breaching the targeted level will extend silver gains to reach $19.38, while breaking $17.43 will push the price to suffer more of the losses with a downward target at $16.56. The expected trading range for today is between $17.40 support and $17.80 resistance.

Read more: https://www.instaforex.com/forex_analysis/89017
]Best Regards,
PR Manager
InstaForex Companies Group
http://www.instaforex.com[/b]
My Webpage
 

Offline Instaforexbuk

  • Sr. Member
  • ****
  • Posts: 436
  • Karma: +0/-0
Re: InstaForex - instaforex.com
« Reply #114 on: March 09, 2017, 04:17:27 PM »
USD/CHF: Remain bearish below strong resistance

We remain bearish looking to sell below 1.0142 resistance (Fibonacci extension, Fibonacci retracement, horizontal resistance) for a push down to 1.0071 support (Fibonacci retracement, horizontal swing low support).

Stochastic (55,5,3) is seeing major resistance below the 95% level.

 Sell below 1.0142. Stop loss is at 1.0116. Take profit is at 1.0071.


Read more: https://www.instaforex.com/forex_analysis/89070
]Best Regards,
PR Manager
InstaForex Companies Group
http://www.instaforex.com[/b]
My Webpage
 

Offline Instaforexbuk

  • Sr. Member
  • ****
  • Posts: 436
  • Karma: +0/-0
Re: InstaForex - instaforex.com
« Reply #115 on: March 10, 2017, 04:42:02 PM »
USDJPY Fundamental Analysis March 10, 2017

USD/JPY has shown a good amount of strength recently climbing from 113.65 to now above 115.00. Yesterday USD Unemployment claims were published at it was a bit higher than expected at 239k but was published at 243k and JPY Average Cash Earning report was expected to be 0.3% but was published at 0.5%, the economic not quite affect the gains of USD that much yesterday. Today JPY had BSI Manufacturing Index report where the expectation was at 8.4 but the report was published at 1.1, a big downturn in this event. On the other hand, today is most important day for USD as Non-Farm payroll report is going to published which is expected to be at 200k which previously was at 227k, Unemployment rate is expected to be at 4.7% which previously was at 4.8% and Average Hourly Earning is expected to be at 0.3% which previously was at 0.1%. As of important events of USD, the pair is expected to be very volatile during the events and the volatility will describe the upcoming moves for the next week.

Now let us look at the technical view, the price is currently residing above 115.00 and it is expected that the price will fall back toward nearest support at 114.75 and then if any bearish rejection is observed we will look to buy with a target toward 118. On the other hand, if the price breaks below the support 114.75 with a daily close and remains below, then the bias will be changed to bearish with a downward target toward 113.65.


Read more: https://www.instaforex.com/forex_analysis/89088
]Best Regards,
PR Manager
InstaForex Companies Group
http://www.instaforex.com[/b]
My Webpage
 

Offline Instaforexbuk

  • Sr. Member
  • ****
  • Posts: 436
  • Karma: +0/-0
Re: InstaForex - instaforex.com
« Reply #116 on: March 13, 2017, 04:41:42 PM »
Daily analysis of Gold for March 13, 2017


Overview

Gold price tested the critical resistance level at 1,211.30 as we mentioned this morning. The price needs to breach this level to confirm the continuation of the positive scenario in the short term. The next main target is located at 1,231.13. Therefore, we will keep our positive expectations unless the price breaks 1,195.28 and holds below it. The current negativity of the stochastics might force the price to show some temporary declines before resuming the expected bullish bias. Besides, we should bear in mind that breaking 1,195.28 will turn the price to the bearish correctional track, so its next target is seen at 1,179.26. The expected trading range for today is between 1195.28 support and 1220.00 resistance.

Read more: https://www.instaforex.com/forex_analysis/89192
]Best Regards,
PR Manager
InstaForex Companies Group
http://www.instaforex.com[/b]
My Webpage
 

Offline Instaforexbuk

  • Sr. Member
  • ****
  • Posts: 436
  • Karma: +0/-0
Re: InstaForex - instaforex.com
« Reply #117 on: March 14, 2017, 02:49:25 PM »
AUD/USD reaching profit target, remain bullish

Price has shot up and is approaching our profit target. We remain bullish looking to buy on weakness above 0.7549 support (Fibonacci retracement, horizontal support) for a further push up to 0.7632 resistance (Fibonacci retracement, horizontal overlap resistance).

RSI (55) sees a bullish exit made signalling a change in momentum to bullish.

Buy above 0.7549. Stop loss at 0.7487. Take profit at 0.7632.


Read more: https://www.instaforex.com/forex_analysis/89238
]Best Regards,
PR Manager
InstaForex Companies Group
http://www.instaforex.com[/b]
My Webpage
 

Offline Instaforexbuk

  • Sr. Member
  • ****
  • Posts: 436
  • Karma: +0/-0
Re: InstaForex - instaforex.com
« Reply #118 on: March 15, 2017, 03:50:09 PM »
Daily analysis of gold for March 15, 2017


Overview

Gold price fluctuates near $1,200.00 level, and we are still waiting for the rally higher to breach $1,211.30 level and confirm continuation of the expected bullish trend on the intraday and short-term basis. The first upside target lies at $1,231.13. In general, we will keep our positive expectations for today unless the price breaks the level of $1,195.28 and holds below it. In this case gold will suffer more losses and may decline to $1,197.26 before making any new attempts to rise. The expected trading range for today is between $1,195.28 support and $1,215.00 resistance.

Read more: https://www.instaforex.com/forex_analysis/89308
]Best Regards,
PR Manager
InstaForex Companies Group
http://www.instaforex.com[/b]
My Webpage
 

Offline Instaforexbuk

  • Sr. Member
  • ****
  • Posts: 436
  • Karma: +0/-0
Re: InstaForex - instaforex.com
« Reply #119 on: March 16, 2017, 05:15:26 PM »
Daily analysis of USDX for March 16, 2017

USDX plunged to test the 100.60 level across the board after FOMC's decision to raise rates by first time in 2017. That bearish move is putting pressure on the index for the short-term, as traders are trying to decide which would be the next path for US Dollar. If a breakout happens below 100.44, then it can reach the 99.91 level.


H1 chart's resistance levels: 101.53 / 102.39

H1 chart's support levels: 100.44 / 99.91

 Trading recommendations for today: Based on the H1 chart, place buy (long) orders only if the USD Index breaks with a bullish candlestick; the resistance level is at 102.39, take profit is at 103.40 and stop loss is at 100.68.

Read more: https://www.instaforex.com/forex_analysis/89316
]Best Regards,
PR Manager
InstaForex Companies Group
http://www.instaforex.com[/b]
My Webpage


Company News from instaforex

Started by Instaforexbuk

Replies: 48
Views: 144723
Last post October 31, 2018, 03:22:55 PM
by Instaforexbuk