Happy New Year 2026 to all our members and visitors! Our Forum is Now Back Online After Some Critical Upgrade- We Apologize for the inaccessibility Period! Thank You all. CORONAVIRUS safety tips from Admin! 1. Watch your hands with running water 2. Dont cough in your hands 3. Keep distance from people 4. Stay indoor if neccessary!! Stay safe !!! Dear Members,Do you know that naijacrux is fully programmed to serve you better, Do you know that you can share your favorite post on naijacrux with friends on twitter,facebook, googleplus,myspace and many more! To share post on naijacrux with friends and family on twitter, facebook,googleplus,myspace,and many more, scroll to the down page of the post, Click on the Social Icon You Want To Share On To Share.


Author Topic: InstaForex - instaforex.com  (Read 573806 times)

0 Members and 1 Guest are viewing this topic.

Offline Instaforexbuk

  • Sr. Member
  • ****
  • Posts: 436
  • Karma: +0/-0
Re: InstaForex - instaforex.com
« Reply #210 on: December 14, 2017, 12:56:23 PM »
Advertisement
Wave analysis of the EUR/USD currency pair for December 14, 2017


Analysis of wave counting: The lack of unity among the members of the FOMC committee in making a decision to raise the rate had a negative impact on the dollar, which in turn led to an increase in the price of the EUR/USD pair at 1.1830 at the end of the previous day. The current wave situation makes it possible to consider the lows reached on Tuesday as the completion of the wave c, in a, in c, in a, in (C), and yesterday's upward movement as the process of formation of wave b, in c,in a, in (C) . If this is the case, the currency pair may resume the decline of quotations, after testing the mark of 1.1850, or even the level of the 19th figure. Targets for a downward wave option: 1.1736 - 38.2% by Fibonacci 1.1666 - 23.6% by Fibonacci Targets for an upward wave option: 1.1850-1.1900 General conclusions and trading recommendations: The construction of the downward trend section continues. The assumed wave a, in c, in a, in (C) has completed its construction. If this assumption is correct, then the increase in quotations may continue with targets located near the mark of 1.1850 and about 19 figures. After that, the decline will resume within the wave c, in c, in a, in (C) with targets below 1.1736, which corresponds to 38.2% of Fibonacci. *The market analysis posted here is meant to increase your awareness, but not to give instructions to make a trade.

Read more: https://www.instaforex.com/forex_analysis/195831
]Best Regards,
PR Manager
InstaForex Companies Group
http://www.instaforex.com[/b]
My Webpage
 

Offline Instaforexbuk

  • Sr. Member
  • ****
  • Posts: 436
  • Karma: +0/-0
Re: InstaForex - instaforex.com
« Reply #211 on: December 15, 2017, 09:13:31 AM »
Technical analysis of GBP/JPY for December 15, 2017


GBP/JPY is expected to continue its downside movement and we are going to retain our yesterday's outlook. The pair is holding on the downside. The downward momentum is further reinforced by both declining 20-period and 50-period moving averages. The relative strength index calls for another decline. To conclude, as long as 151.95 is not surpassed, look for a new test with targets at 150.50 and 150.00 in extension. Alternatively, if the price moves in the direction opposite to the forecast, a long position is recommended above 151.95 with the target at 152.40 Strategy: SELL, Stop Loss: 151.95, Take Profit: 150.50 Chart Explanation: the black line shows the pivot point. The price above the pivot point indicates long positions; and when it is below the pivot points, it indicates short positions. The red lines show the support levels and the green line indicates the resistance levels. These levels can be used to enter and exit trades. Resistance levels: 152.40, 152.85, and 153.15 Support levels: 150.50, 150.00, and 149.45

Read more: https://www.instaforex.com/forex_analysis/105583
]Best Regards,
PR Manager
InstaForex Companies Group
http://www.instaforex.com[/b]
My Webpage
 

Offline Instaforexbuk

  • Sr. Member
  • ****
  • Posts: 436
  • Karma: +0/-0
Re: InstaForex - instaforex.com
« Reply #212 on: December 18, 2017, 10:15:19 AM »
Daily analysis of GBP/USD for December 18, 2017 /color]

GBP/USD plummeted strongly during Friday's session and tested December 12th lows. Following the sharp decline, the pair entered in a consolidation phase that could allow a lower low pattern formation across the board, which should deliver further losses in the pair. If it manages to break below 1.3303, the next step should be the 1.3234 level to overcome.


H1 chart's resistance levels: 1.3444 / 1.3516 H1 chart's support levels: 1.3303 / 1.3234 Trading recommendations for today: Based on the H1 chart, buy (long) orders only if the GBP/USD pair breaks a bullish candlestick; the resistance level is at 1.3444, take profit is at 1.3516 and stop loss is at 1.3372.

Read more: https://www.instaforex.com/forex_analysis/105631
]Best Regards,
PR Manager
InstaForex Companies Group
http://www.instaforex.com[/b]
My Webpage
 

Offline Instaforexbuk

  • Sr. Member
  • ****
  • Posts: 436
  • Karma: +0/-0
Re: InstaForex - instaforex.com
« Reply #213 on: December 19, 2017, 04:32:48 PM »
GBP/USD analysis for December 19, 2017


Recently, the GBP/USD pair has been trading sideways at the price of 1.3372. According to the 15M time - frame, I found a broken intraday bearish flag in the background, which is a sign that buying looks risky. I also found overbought conditions on the stochastic oscillator. My advice is to watch for potential selling opportunities. The downward targets are set at the price of 1.3320 (pivot support 1) and at the price of 1.3255 (pivot support 2). Resistance levels: R1: 1.3432 R2: 1.3480 R3: 1.3545 Support levels: S1: 1.3320 S2: 1.3255 S3: 1.3206 Trading recommendations for today: watch for potential selling opportunities. *The market analysis posted here is meant to increase your awareness, but not to give instructions to make a trade.

Read more: https://www.instaforex.com/forex_analysis/105815
]Best Regards,
PR Manager
InstaForex Companies Group
http://www.instaforex.com[/b]
My Webpage
 

Offline Instaforexbuk

  • Sr. Member
  • ****
  • Posts: 436
  • Karma: +0/-0
Re: InstaForex - instaforex.com
« Reply #214 on: December 20, 2017, 11:14:55 AM »
Fundamental Analysis of EUR/JPY for December 20, 2017

EUR/JPY has been quite bullish this week residing inside the corrective range of 131.40 to 134.40. EUR has been quite impulsive with the recent gains against JPY. EUR found support from the eurozone's upbeat economic reports whereas JPY is struggling to gain sustainable momentum. Today, Japan's All Industry Activity report was published with an increase to 0.3% from the previous value of -0.5% but it could not meet the expectation of +0.4%. The positive economic report helped the currency to gain some momentum over EUR but keeping this pressure is going to be a bit of a challenge for JPY. On the EUR side, today German PPI was published with a decrease to 0.1% from the previous value of 0.3% which was expected to be at 0.2%, Current Account report is yet to be published which is expected to decrease to 33.4B from the previous figure of 37.8B, Belgian NBB Business Climate is expected to increase to 2.0 from the previous figure of 1.6, and German Buba President Weidmann is going to speak about the outlook for the monetary policy and interest rates decision. His rhetoric is expected to be quite neutral in nature. As for the current scenario, EUR has a lot to offer today despite the worse economic report from Germany. As the global trading day progresses, any positive economic report or event today will add up to the bullish gains in the pair. On the other hand, negative readings of economic reports today will help JPY to gain momentum in the coming days. Now let us look at the technical chart. The price is currently residing above the dynamic level of 20 EMA inside the range of 131.40 to 134.40 area. The price is following the bullish bias, aiming to move higher towards 135.50 as the price remains above 131.40 support level with a daily close. On the other hand, if the price breaks below 131.40 with a daily close, then the bears are likely to take over and push the price lower towards 129.80 support area.


Read more: https://www.instaforex.com/forex_analysis/105877
]Best Regards,
PR Manager
InstaForex Companies Group
http://www.instaforex.com[/b]
My Webpage
 

Offline Instaforexbuk

  • Sr. Member
  • ****
  • Posts: 436
  • Karma: +0/-0
Re: InstaForex - instaforex.com
« Reply #215 on: December 21, 2017, 03:17:30 PM »
Global macro overview for 21/12/2017

Most of the attention may focus today around the Canadian currency due to a number of publications from Canada. Today we will learn about Canadian retail sales for October, where the market consensus assumes sales increase by 0.3% in monthly terms as compared to an increase of 0.1% in the previous period. In addition, CPI inflation will be released, where it is expected to accelerate this indicator to 2.0% from 1.4% per annum. In the case of the core index, the indicator is expected to slightly slow down to 0.8% from 0.9% per annum. In particular, inflation data will be monitored due to the recent return of the bank of Canada comments towards more hawkish monetary policy. Although in the opinion of the bank stronger than anticipated increase in inflation results from temporary factors (mainly energy prices), it is worth noting that measures of core inflation have increased in recent months. BoC openly admitted that further interest rate hikes will be required in the future, so a higher inflation reading and retail sales should support CAD across the board Let's now take a look at the USD/CAD technical picture in the H4 time frame. The market has tested the technical resistance at the level of 1.2919 four times already, but the bulls were too weak to break out above this level. The market remains in a sideways consolidation zone between the levels of 1.2620 - 1.2919 with neutral momentum at the time of writing. Better than expected data from Canada may become an impulse to go below the round level of 1.2800.


Read more: https://www.instaforex.com/forex_analysis/106031
]Best Regards,
PR Manager
InstaForex Companies Group
http://www.instaforex.com[/b]
My Webpage
 

Offline Instaforexbuk

  • Sr. Member
  • ****
  • Posts: 436
  • Karma: +0/-0
Re: InstaForex - instaforex.com
« Reply #216 on: December 22, 2017, 08:54:45 AM »
Elliott wave analysis of EUR/JPY for December 22, 2017


Wave summary: With the break above 134.50, more upside pressure towards the "old" (D)-wave target at 137.37 is expected. That said, we have to remember that we are in the final stages of this (D)-wave rally from 109.54, so don't fall in love with the EUR at these lofty levels. Support is seen at 133.84 (has been tested) and again at 133.57, which should protect the downside for the next rally higher. Below 133.57 will be of concern and indicate a possible bull-trap above 134.50. R3: 136.05 R2: 135.75 R1: 134.90 Pivot: 134.40 S1: 133.84 S2: 133.57 S3: 133.24 Trading recommendation: We bought EUR at 134.10 with stop placed at 133.40. *The market analysis posted here is meant to increase your awareness, but not to give instructions to make a trade.

Read more: https://www.instaforex.com/forex_analysis/106077
]Best Regards,
PR Manager
InstaForex Companies Group
http://www.instaforex.com[/b]
My Webpage
 

Offline Instaforexbuk

  • Sr. Member
  • ****
  • Posts: 436
  • Karma: +0/-0
Re: InstaForex - instaforex.com
« Reply #217 on: December 27, 2017, 08:56:01 AM »
Fundamental Analysis of USD/CAD for December 27, 2017

USD/CAD is currently quite bearish, having 1.27 support level cleared with a daily close which opened the doors for the price to proceed much downward in the coming days. CAD has been quite positive with the gains recently despite a lack of any economic reports or events to support its recent gains, but it seems like the weakness of USD is the working factor in this case. USD has been quite weaker recently amid mixed economic reports which made the US currency lose ground against other rival currencies. Today, US CB Consumer Confidence report is going to be published which is expected to decrease to 128.2 from the previous figure of 129.5 and Pending Home Sales is expected to be negative at -0.4% from the previous value of 3.5%. The economic reports from the US are quite negatively forecasted. If that happens, then CAD is going to dominate further in the coming days until the US comes up with any positive economic reports or events to help it regain the momentum it has lost recently. Now let us look at the technical chart. The price is currently hovering below the 1.2700 event level which held the price earlier. However, this time the price had a break with a daily close below the level which indicates that the price is going to proceed much lower towards 1.2450 in the coming days. As the price remains below 1.27 with a daily close, the bearish bias is expected to continue further.


Read more: https://www.instaforex.com/forex_analysis/106258
]Best Regards,
PR Manager
InstaForex Companies Group
http://www.instaforex.com[/b]
My Webpage
 

Offline Instaforexbuk

  • Sr. Member
  • ****
  • Posts: 436
  • Karma: +0/-0
Re: InstaForex - instaforex.com
« Reply #218 on: December 28, 2017, 08:39:39 AM »
Technical analysis of USD/CHF for December 28, 2017


USD/CHF is expected to trade with a bearish outlook. The pair is clearly reversing down, capped by its falling 20-period and 50-period moving averages. The recent bearish breakout of a key horizontal level at 0.9885 should open the downside path toward 0.9810. Last but not least, the relative strength index is badly directed and calls for a new pullback. To conclude, as long as 0.9875 isn't surpassed, look for further downsides to 0.9810 and 0.9795 in extension. Chart Explanation: The black line shows the pivot point. The present price above the pivot point indicates a bullish position, and the price below the pivot points indicates a short position. The red lines show the support levels and the green line indicates the resistance levels. These levels can be used to enter and exit trades. Strategy: SELL, Stop Loss: 0.9875, Take Profit: 0.9810 Resistance levels: 0.9900, 0.9915, and 0.9935 Support levels: 0.9810, 0.9795, and 0.9750 *The market analysis posted here is meant to increase your awareness, but not to give instructions to make a trade.

Read more: https://www.instaforex.com/forex_analysis/106356
]Best Regards,
PR Manager
InstaForex Companies Group
http://www.instaforex.com[/b]
My Webpage
 

Offline Instaforexbuk

  • Sr. Member
  • ****
  • Posts: 436
  • Karma: +0/-0
Re: InstaForex - instaforex.com
« Reply #219 on: December 29, 2017, 08:37:24 AM »
Burning Forecast 29/12/2017

Burning Forecast 29/12/2017 EURUSD: Buy from kickbacks. The euro was on the growth trend in the final days of 2017. A break above 1.1900 and the consolidation above this level is a strong signal for growth. At the moment, the course is testing the next important resistance of 1.1960 - and, if successful, a target of 1.2080 - a peak of the year. Purchases are possible, but we must bear in mind that on the first trading day of January, and generally during the first week, there is a high probability of strong gaps and sudden unpredictable movements. Therefore, we are buying the euro from 1.1900. Merry Christmas and Happy New Year!

]Best Regards,
PR Manager
InstaForex Companies Group
http://www.instaforex.com[/b]
My Webpage
 

Offline Instaforexbuk

  • Sr. Member
  • ****
  • Posts: 436
  • Karma: +0/-0
Re: InstaForex - instaforex.com
« Reply #220 on: January 02, 2018, 08:21:21 AM »
AUD/JPY testing major resistance, time to go short

Price is testing major resistance at 88.09 (Fibonacci retracement, horizontal swing high resistance) and we expect a strong drop from this level towards 86.69 support (Fibonacci retracement, horizontal support). Stochastic (55,3,1) is seeing major resistance at 99% and is starting to drop nicely signalling a further drop could be expected. Sell below 88.09. Stop loss at 88.71. Take profit at 86.69.

]Best Regards,
PR Manager
InstaForex Companies Group
http://www.instaforex.com[/b]
My Webpage
 

Offline Instaforexbuk

  • Sr. Member
  • ****
  • Posts: 436
  • Karma: +0/-0
Re: InstaForex - instaforex.com
« Reply #221 on: January 03, 2018, 10:49:49 AM »
Trade review for January 3 by simplified wave analysis

Overview and forecast for EUR / USD

The graph of the European currency in the main pair against the dollar after the correction period resumed its growth. The quotes of the pair reached a critical point again, which divides the two main options for the future scenario. In the first case, the current stretched plane of large scale will be continued further. An alternative option involves pre-shaping the correction at a higher wave level. Today is probably the end of the rise of the past days. Turning is not expected above the resistance zone levels. At the beginning of the course of the price down can be calculated in the second half of the day. The lower limit of the daily course of the pair is the settlement support. The boundaries of the resistance zones: - 1.2080 / 1.2110 The boundaries of the support zone: - 1.2000 / 1.1970


Overview and forecast for USD / CAD

The direction of the short-term trend on the chart of the major pair of the Canadian dollar is set by the upward wave of September 8 last year. During the last 2 months, the price is adjusted, forming a wave zigzag. The preliminary calculation of the target zone gives, as the nearest landmark of the completion of the wave, the mid-hundred, and twenty-fifth price pattern. Today, the formation of a corrective rollback is likely. The flute nature of price fluctuations will become dominant. The swing upwards limits the calculated resistance zone. Then you should wait for a return to the main course of the movement and a new section for strengthening the Canadian currency. The boundaries of the resistance zones: - 1.2580 / 1.2610 The boundaries of the support zones: - 1.2500 / 1.2470


Explanations to the figures: For simplified wave analysis, the simplest type of wave is used in the form of a zigzag, combining 3 parts (A; B; C). Of these waves, all kinds of correction are composed and most of the impulses. At each time frame, the last, incomplete wave is analyzed. The areas marked on the graphs are indicated by the calculation areas, where the probability of a change in the direction of motion is significantly increased. Arrows indicate the wave counting according to the technique used by the author. The solid background of the arrows indicates the structure formed, the dotted one indicates the expected wave motion. Attention: The wave algorithm does not take into account the duration of the tool movements in time. The forecast is not a trading signal! To conduct a trade transaction, you need to confirm the signals of your trading systems. *The market analysis posted here is meant to increase your awareness, but not to give instructions to make a trade.

Read more: https://www.instaforex.com/forex_analysis/196967
]Best Regards,
PR Manager
InstaForex Companies Group
http://www.instaforex.com[/b]
My Webpage
 

Offline Instaforexbuk

  • Sr. Member
  • ****
  • Posts: 436
  • Karma: +0/-0
Re: InstaForex - instaforex.com
« Reply #222 on: January 04, 2018, 03:44:38 PM »
Wave analysis of the GBP / USD currency pair for January 4, 2018


Analysis of wave counting: On the whole, it is expected that the breakdown of the level of the 36th figure led to a fairly dynamic decline in the price of the pair GBP / USD at the beginning of yesterday's European session by almost 120 percentage points from the previously reached maximum (1.3610). Thus, the emerging wave situation allows us to assume (with some stretch) that the currency pair has completed the formation of the third wave and has already designated the beginning of the 4th wave, in the 5th, a, B, C, C, (C). In this case, in the case of a downward movement to 1.3300, the 2nd wave, in the 5th, a, B, C, C, (C), significantly complicates its internal wave structure. The objectives of building the downward wave: 1.3480 - 11.4% by Fibonacci 1.3291 - 23.6% by Fibonacci 1.3200 The objectives for the construction of an upward wave: 1.3600 - 1.3700 General conclusions and trade recommendations: The construction of the upward trend section continues. It is now possible to resume the increase in quotes within the wave 5, 5, a, B, C, C, (C) with targets that are about 36 and 37 figures. The overbought indicators allow the probability of complicating the wave 2, 5, a, B, C, C, (C). *The market analysis posted here is meant to increase your awareness, but not to give instructions to make a trade.

Read more: https://www.instaforex.com/forex_analysis/197061
]Best Regards,
PR Manager
InstaForex Companies Group
http://www.instaforex.com[/b]
My Webpage
 

Offline Instaforexbuk

  • Sr. Member
  • ****
  • Posts: 436
  • Karma: +0/-0
Re: InstaForex - instaforex.com
« Reply #223 on: January 05, 2018, 01:53:20 PM »
Technical analysis of USD/JPY for Jan 05, 2018


Japan will release the Monetary Base y/y and the US will reveal some Economic Data such as Factory Orders m/m, ISM Non-Manufacturing PMI, Trade Balance, Unemployment Rate, Non-Farm Employment Change, and Average Hourly Earnings m/m . So there is a probability the USD/JPY pairwill move with medium to high volatility during this day. TODAY'S TECHNICAL LEVEL: Resistance. 3: 113.34. Resistance. 2: 113.12. Resistance. 1: 112.90. Support. 1: 112.62. Support. 2: 112.40. Support. 3: 112.18. Disclaimer: Trading Forex (foreign exchange) on margin carries a high level of risk, and may not be suitable for all investors. The high degree of leverage can work against you as well as for you. Before deciding to invest in foreign exchange you should carefully consider your investment objectives, level of experience, and risk appetite. The possibility exists that you could sustain a loss of some or all of your initial investment and therefore you should not invest money that you cannot afford to lose. You should be aware of all the risks associated with foreign exchange trading, and seek advice from an independent financial advisor if you have any doubts. *The market analysis posted here is meant to increase your awareness, but not to give instructions to make a trade.

Read more: https://www.instaforex.com/forex_analysis/106788
]Best Regards,
PR Manager
InstaForex Companies Group
http://www.instaforex.com[/b]
My Webpage
 

Offline Instaforexbuk

  • Sr. Member
  • ****
  • Posts: 436
  • Karma: +0/-0
Re: InstaForex - instaforex.com
« Reply #224 on: January 08, 2018, 09:20:43 AM »
Daily analysis of GBP/USD for January 08, 2018


GBP/USD hadn't a major reaction to the US NFP outcome on Friday, as it remains trading in a tight range across the board. Currently, the pair is being supported by the 1.3526 level, which should give enough momentum in order to strengthen the bullish bias and it will help to push it to test the resistance zone of 1.3700. MACD indicator remains in favor of the bulls.


H1 chart's resistance levels: 1.3589 / 1.3700 H1 chart's support levels: 1.3526 / 1.3451 Trading recommendations for today: Based on the H1 chart, buy (long) orders only if the GBP/USD pair breaks a bullish candlestick; the resistance level is at 1.3589, take profit is at 1.3700 and stop loss is at 1.3480.

Read more: https://www.instaforex.com/forex_analysis/106858
]Best Regards,
PR Manager
InstaForex Companies Group
http://www.instaforex.com[/b]
My Webpage
 

Offline Instaforexbuk

  • Sr. Member
  • ****
  • Posts: 436
  • Karma: +0/-0
Re: InstaForex - instaforex.com
« Reply #225 on: January 09, 2018, 08:50:17 AM »
Technical analysis of USD/JPY for Jan 09, 2018


In Asia, Japan will release the Consumer Confidence and Average Cash Earnings y/y data, and the US will release some Economic Data such as IBD/TIPP Economic Optimism, JOLTS Job Openings, and NFIB Small Business Index. So, there is a probability the USD/JPY will move with a low to medium volatility during this day.

 TODAY'S TECHNICAL LEVEL:

Resistance. 3: 113.16.

Resistance. 2: 112.96.

Resistance. 1: 112.74.

 Support. 1: 113.46.

Support. 2: 112.23.

Support. 3: 112.01.

Disclaimer: Trading Forex (foreign exchange) on margin carries a high level of risk, and may not be suitable for all investors. The high degree of leverage can work against you as well as for you. Before deciding to invest in foreign exchange you should carefully consider your investment objectives, level of experience, and risk appetite. The possibility exists that you could sustain a loss of some or all of your initial investment and therefore you should not invest money that you cannot afford to lose. You should be aware of all the risks associated with foreign exchange trading, and seek advice from an independent financial advisor if you have any doubts. *The market analysis posted here is meant to increase your awareness, but not to give instructions to make a trade.

Read more: https://www.instaforex.com/forex_analysis/106964
]Best Regards,
PR Manager
InstaForex Companies Group
http://www.instaforex.com[/b]
My Webpage
 

Offline Instaforexbuk

  • Sr. Member
  • ****
  • Posts: 436
  • Karma: +0/-0
Re: InstaForex - instaforex.com
« Reply #226 on: January 10, 2018, 09:03:43 AM »
Brent: "Bears" threw a towel into the ring

Frosts in the northeastern United States, the continuing decline in US oil reserves, the anti-government strikes in Iran, the high level of compliance with contractual obligations by OPEC members, and the weakness of the dollar pushed the quotations of Brent and WTI to the area of three-year highs. However, some of black gold's advantages, in particular, problems with supplies in the North Sea and in Libya, have already been played. Tehran has not reduced production and the US currency is beginning to win back part of the losses incurred at the turn of 2017-2018 decline. These circumstances require that the "bulls" have evidence that they are able to retain both varieties at current levels.

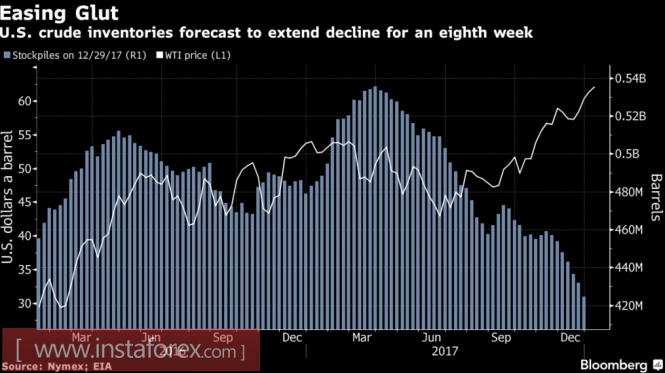
According to the consensus forecast of Bloomberg experts, by the week ending in January 5, oil reserves in the United States have already decreased by 1.5 million barrels. If this is the case, the figure will drop 8 five consecutive days and will reach a minimum mark since the beginning of 2015. At the same time, the number of drilling rigs, according to the latest report of Baker Hughes, unexpectedly decreased by 5. It seems that the rate that shale oil producers will increase its own activity as WTI moved above $ 60 per barrel, was not justified. However, this threat made Iran's oil minister say that OPEC does not want Brent to go far from $ 60.

Dynamics of WTI and US oil reserves


Source: Bloomberg.

Tehran is forced to use this rhetoric as part of the "bullish" news for black gold comes from it. The country, which accounts for about 4% of world production (3.8 million bpd), cannot afford to live in the face of the growing risks of an anti-government coup. It indeed has retained its previous production levels but who knows what will happen tomorrow. The situation is aggravated by the conflict between Iran and Saudi Arabia over Yemen as well as rumors that Donald Trump will not confirm the terms of the nuclear deal with Tehran. The renewal of sanctions is fraught with a reduction in world production and rising prices. The world demand plays an important role in the current Brent and WTI rally. According to IMF forecasts, the global GDP will grow by 3.6% in 2018. At the same time the increase in consumption of black gold increased to 5 million bpd from 2015 to 2017. However, at the time when the North Sea grade was quoted at $ 100 per barrel or higher, it did not reach +1 million bpd. The continuation of the northern oil campaign will have an impact not only on demand, but also on inflation. Accelerated growth in consumer prices in the US will contribute to the aggressive monetary restriction of the Fed, which will strengthen the position of the dollar. Currently, the US currency has an undisclosed potential. First, the market ignored the factor of tax reform and it is quite capable of winning it back. Second, the divergence in the monetary policy of the Fed and its main competitors continues to work in favor of the USD index. Technically, if the "bulls" for Brent manage to keep the positions won, then the risks of continuing the rally in the direction of the target by 200% on the AB = CD pattern will increase. On the contrary, falling prices below $ 66.95 per barrel will open the door for correction.

Brent, daily chart

]Best Regards,
PR Manager
InstaForex Companies Group
http://www.instaforex.com[/b]
My Webpage
 

Offline Instaforexbuk

  • Sr. Member
  • ****
  • Posts: 436
  • Karma: +0/-0
Re: InstaForex - instaforex.com
« Reply #227 on: January 12, 2018, 02:17:19 PM »
USD/JPY analysis for January 12, 2018


Recently, the USD/JPY pair has been trading downwards. As I expected, the price tested the level of 110.97. According to the 30M time – frame, I found a broken bearish pennant, which is a sign that sellers are in control. Another sign of weakness is the breakout of yesterday's low at the prrice of 111.04. My advice is to watch for potential selling opportunities. The downward target is set at the price of 110.60.

Resistance levels:

R1: 111.75

 R2: 112.25

R3: 112.60

Support levels:

S1: 110.90

S2: 110.55 S3: 110.05

Trading recommendations for today: watch for potential selling opportunities.

Read more: https://www.instaforex.com/forex_analysis/107308
]Best Regards,
PR Manager
InstaForex Companies Group
http://www.instaforex.com[/b]
My Webpage
 

Offline Instaforexbuk

  • Sr. Member
  • ****
  • Posts: 436
  • Karma: +0/-0
Re: InstaForex - instaforex.com
« Reply #228 on: January 15, 2018, 09:07:12 AM »
Technical analysis of NZD/USD for January 15, 2018


Our first target which we predicted in the previous analysis has been hit. NZD/USD is expected to trade with a bullish outlook. The pair accelerated on the upside, and now remains supported by its rising 20-period and 50-period moving averages. The relative strength index is bullish but has not yet displayed any reversal signal. In which case, as long as 0.7230 is not broken, likely advance to 0.7300 and 0.7330 in extension. The black line shows the pivot point. Currently, the price is above the pivot point, which is a signal for long positions. If it remains below the pivot point, it will indicate short positions. The red lines are showing the support levels, while the green line is indicating the resistance levels. These levels can be used to enter and exit trades.

Resistance levels: 0.7280, 0.7300, and 0.7330.

Support levels: 0.7210, 0.7180, and 0.7150.

Read more: https://www.instaforex.com/forex_analysis/107374
]Best Regards,
PR Manager
InstaForex Companies Group
http://www.instaforex.com[/b]
My Webpage
 

Offline Instaforexbuk

  • Sr. Member
  • ****
  • Posts: 436
  • Karma: +0/-0
Re: InstaForex - instaforex.com
« Reply #229 on: January 16, 2018, 05:06:38 PM »
Technical analysis of NZD/USD for January 16, 2018


Our first target which we predicted in yesterday's analysis has been hit. The pair remains on the upside, backed by its rising 50-period moving average. A strong support base has formed around 0.7275, which should limit any downward attempts. Besides, the relative strength index stands firmly above its neutrality area at 50. Even though a consolidation cannot be ruled out, its extent should be limited. As long as 0.7250 is not broken, likely advance to 0.7300 and 0.7330 in extension. The black line shows the pivot point. Currently, the price is above the pivot point, which is a signal for long positions. If it remains below the pivot point, it will indicate short positions. The red lines are showing the support levels, while the green line is indicating the resistance levels. These levels can be used to enter and exit trades.

Resistance levels: 0.73000, 0.7330, and 0.7375.

Support levels: 0.7220, 0.7175, and 0.7150.

Read more: https://www.instaforex.com/forex_analysis/107571
]Best Regards,
PR Manager
InstaForex Companies Group
http://www.instaforex.com[/b]
My Webpage
 

Offline Instaforexbuk

  • Sr. Member
  • ****
  • Posts: 436
  • Karma: +0/-0
Re: InstaForex - instaforex.com
« Reply #230 on: January 17, 2018, 09:28:50 AM »
AUD/JPY dropped perfectly, remain bearish for a further drop

The price has dropped perfectly from our selling area yesterday before bouncing above our ascending support line. This ascending support line would need to be broken to trigger a strong bearish move down. We still remain bearish looking to sell below major resistance at 88.43 (61.8% Fibonacci retracement, Elliott wave corrective structure) for a drop towards 87.24 support (Fibonacci extension, horizontal swing low support). RSI (34) sees major descending resistance line acting as resistance to push the price down from here. Sell below 88.43. Stop loss at 88.70. Take profit at 87.24.


Read more: https://www.instaforex.com/forex_analysis/107596
]Best Regards,
PR Manager
InstaForex Companies Group
http://www.instaforex.com[/b]
My Webpage
 

Offline Instaforexbuk

  • Sr. Member
  • ****
  • Posts: 436
  • Karma: +0/-0
Re: InstaForex - instaforex.com
« Reply #231 on: January 19, 2018, 01:04:23 PM »
AUD/JPY testing major resistance, prepare for a drop

The price is testing major resistance at 88.98 (Fibonacci extension, horizontal swing high resistance, bearish harmonic formation) and we expect to see a strong reaction off this level to push the price down towards 88.41 support (Fibonacci retracement, horizontal overlap support). Stochastic (34,5,3) is seeing major resistance below 96% where further bearish momentum is expected. Sell below 88.98. Stop loss at 89.22. Take profit at 88.41.


Read more: https://www.instaforex.com/forex_analysis/107791
]Best Regards,
PR Manager
InstaForex Companies Group
http://www.instaforex.com[/b]
My Webpage
 

Offline Instaforexbuk

  • Sr. Member
  • ****
  • Posts: 436
  • Karma: +0/-0
Re: InstaForex - instaforex.com
« Reply #232 on: January 30, 2018, 12:42:10 PM »
GBP/USD analysis for January 30, 2018


Recently, the GBP/USD pair has been trading downwards. The price tested the level of 1.3979. Anyway, according to the 30M time – frame, I found a bullish breakout of the supply trendline (resistance), which is a sign that buyers are in control. I also found a hidden bullish divergence on the moving average oscillator and a fake breakout of yesterday's low, which is another sign of strength. My advice is to watch for potential buying opportunities. The upward targets are set at the price of 1.4092 and at the price of 1.4150.

Resistance levels:

R1: 1.4148

R2: 1.4220

R3: 1.4280

Support levels:

S1: 1.4015

S2: 1.3950

S3: 1.3880

Trading recommendations for today: watch for potential buying opportunities.

Read more: https://www.instaforex.com/forex_analysis/108590
]Best Regards,
PR Manager
InstaForex Companies Group
http://www.instaforex.com[/b]
My Webpage
 

Offline Instaforexbuk

  • Sr. Member
  • ****
  • Posts: 436
  • Karma: +0/-0
Re: InstaForex - instaforex.com
« Reply #233 on: February 01, 2018, 09:20:56 AM »
Technical analysis of EUR/USD for Feb 01, 2018


When the European market opens, some Economic Data will be released such as French 10-y Bond Auction, Spanish 10-y Bond Auction, Final Manufacturing PMI, German Final Manufacturing PMI, French Final Manufacturing PMI, Italian Manufacturing PMI, and Spanish Manufacturing PMI. The US will release the Economic Data too, such as Total Vehicle Sales, Natural Gas Storage, ISM Manufacturing Prices, Construction Spending m/m, ISM Manufacturing PMI, Final Manufacturing PMI, Unemployment Claims, Prelim Unit Labor Costs q/q, Prelim Nonfarm Productivity q/q, and Challenger Job Cuts y/y, so, amid the reports, EUR/USD will move in a medium volatility during this day.

TODAY'S TECHNICAL LEVEL:

Breakout BUY Level: 1.2480.

Strong Resistance:1.2473.

Original Resistance: 1.2461.

Inner Sell Area: 1.2449.

Target Inner Area: 1.2420.

Inner Buy Area: 1.2391.

Original Support: 1.2379.

Strong Support: 1.2367.

Breakout SELL Level: 1.2360.

Disclaimer: Trading Forex (foreign exchange) on margin carries a high level of risk, and may not be suitable for all investors. The high degree of leverage can work against you as well as for you. Before deciding to invest in foreign exchange you should carefully consider your investment objectives, level of experience, and risk appetite. The possibility exists that you could sustain a loss of some or all of your initial investment and therefore you should not invest money that you cannot afford to lose. You should be aware of all the risks associated with foreign exchange trading, and seek advice from an independent financial advisor if you have any doubts.

Read more: https://www.instaforex.com/forex_analysis/108741
]Best Regards,
PR Manager
InstaForex Companies Group
http://www.instaforex.com[/b]
My Webpage
 

Offline Instaforexbuk

  • Sr. Member
  • ****
  • Posts: 436
  • Karma: +0/-0
Re: InstaForex - instaforex.com
« Reply #234 on: February 02, 2018, 07:51:44 AM »
Technical analysis of GBP/JPY for February 2, 2018


Our first upside target which we predicted in yesterday's analysis has been hit. GBP/JPY is expected to trade with a bullish outlook. The pair is clearly in an up-trend, backed by its rising trend line. A strong support base has formed around 136.00, which should limit any downside room. Besides, the relative strength index is bullish, and calls for a new rise. To conclude, as long as 155.70 holds on the downside, look for a new bounce to 157.00 and 157.70 in extension. Alternatively, if the price moves in the direction opposite to the forecast, a Short position is recommended to be below 155.70 with the target at 155.20. Strategy: BUY, Stop loss at 155.70, Take profit at 157.00 Chart Explanation: the black line shows the pivot point. The price above the pivot point indicates long positions; and when it is below the pivot point, it indicates short positions. The red lines show the support levels, and the green line indicates the resistance levels. These levels can be used to enter and exit trades. Resistance levels: 157.00, 157.70, and 158.15 Support levels: 155.20, 154.60, and 154.00.

Read more: https://www.instaforex.com/forex_analysis/108858
]Best Regards,
PR Manager
InstaForex Companies Group
http://www.instaforex.com[/b]
My Webpage
 

Offline Instaforexbuk

  • Sr. Member
  • ****
  • Posts: 436
  • Karma: +0/-0
Re: InstaForex - instaforex.com
« Reply #235 on: February 05, 2018, 10:27:26 AM »
Technical analysis of GBP/JPY for February 5, 2018


GBP/JPY is under pressure. The pair retreated from 156.60 and broke below its 20-period and 50-period moving averages. In addition, the 20-period moving average is turning down. The relative strength index is capped by a declining trend line since February 2. Therefore, below 156, look for a further decline with targets at 156.650 and 157 in extension. Alternatively, if the price moves in the direction opposite to the forecast, a Long position is recommended to be above 156.00 with the target at 156.60.
 Strategy: SELL, Stop loss at 156.00, Take profit at 154.60
Chart Explanation: the black line shows the pivot point. The price above the pivot point indicates long positions; and when it is below the pivot point, it indicates short positions. The red lines show the support levels, and the green line indicates the resistance levels. These levels can be used to enter and exit trades.
Resistance levels: 156.60, 157.00, and 157.45
Support levels: 154.60, 154.10, and 153.70.

Read more: https://www.instaforex.com/forex_analysis/108983
]Best Regards,
PR Manager
InstaForex Companies Group
http://www.instaforex.com[/b]
My Webpage
 

Offline Instaforexbuk

  • Sr. Member
  • ****
  • Posts: 436
  • Karma: +0/-0
Re: InstaForex - instaforex.com
« Reply #236 on: February 07, 2018, 08:25:00 AM »
Technical analysis of USD/JPY for Feb 07, 2018


In Asia, Japan will release the Leading Indicators and Average Cash Earnings y/y data, and the US will release some Economic Data such as Consumer Credit m/m, 10-y Bond Auction, and Crude Oil Inventories. So, there is a probability the USD/JPY will move with a low to medium volatility during this day.

TODAY'S TECHNICAL LEVEL:

Resistance. 3: 109.98.

Resistance. 2: 109.77.

Resistance. 1: 109.55.

Support. 1: 109.28.

Support. 2: 109.07.

Support. 3: 108.85.

Disclaimer: Trading Forex (foreign exchange) on margin carries a high level of risk, and may not be suitable for all investors. The high degree of leverage can work against you as well as for you. Before deciding to invest in foreign exchange you should carefully consider your investment objectives, level of experience, and risk appetite. The possibility exists that you could sustain a loss of some or all of your initial investment and therefore you should not invest money that you cannot afford to lose. You should be aware of all the risks associated with foreign exchange trading, and seek advice from an independent financial advisor if you have any doubts.

Read more: https://www.instaforex.com/forex_analysis/109172
]Best Regards,
PR Manager
InstaForex Companies Group
http://www.instaforex.com[/b]
My Webpage
 

Offline Instaforexbuk

  • Sr. Member
  • ****
  • Posts: 436
  • Karma: +0/-0
Re: InstaForex - instaforex.com
« Reply #237 on: February 08, 2018, 08:11:46 AM »
Fundamental Analysis of USD/CAD for February 8, 2018

USDCAD has been quite impulsive with the bullish gains recently which is expected to continue further in the coming days. USD has been the dominant currency since the recent Employment Change report was published with the significant increase which had a positive impact on the currency to gain against CAD. Ahead of the Employment Change report of CAD which is expected to decrease to 10.3k from the previous figure of 78.6k and Unemployment Rate increasing to 5.8% from the previous value of 5.7%, CAD is expected to lose more grounds against USD in the coming days. Today CAD Housing Starts report is going to be published which is expected to decrease to 211k from the previous figure of 218k, NHPI report is expected to be unchanged at 0.1% and Government Council Member Wilkins is going to speak about upcoming interest rate decision and monetary policies which are expected to inject volatility into the market before today's daily close. On the USD side, today Unemployment Claims report is going to be published which is expected to increase to 232k from the previous figure of 230k and Mortgage Delinquencies, which is the late payment value of the previous quarter for the mortgage, is expected to decrease from the previous value of 4.88%. As of the current scenario, CAD is expected to have worse economic report results in the coming days which is expected to add more to the USD gains. As USD has been in a great momentum after the recent Employment Change report, whereas worse result on the CAD Employment Change is expected to lead to more impulsive gain on USD side in the future.

 Now let us look at the technical view. The price has bounced higher above 1.24 recently after the positive Employment Change report of USD which was also notified in the chart as Regular Bullish Divergence. The price is currently heading towards 1.2620 from where if it is broken with a daily close, further target towards 1.29 is expected in the coming days. As the price remains above 1.24 with a daily close, the bullish bias is expected to continue further.


Read more: https://www.instaforex.com/forex_analysis/109310
]Best Regards,
PR Manager
InstaForex Companies Group
http://www.instaforex.com[/b]
My Webpage
 

Offline Instaforexbuk

  • Sr. Member
  • ****
  • Posts: 436
  • Karma: +0/-0
Re: InstaForex - instaforex.com
« Reply #238 on: February 09, 2018, 08:44:46 AM »
GBP/USD testing major resistance, remain bearish
The price has shot up to test our selling area before reversing nicely once more. We remain bearish looking to sell on strength below major resistance at 1.3991 (Fibonacci retracement, horizontal pullback resistance, double top breakout level) for a strong push down to at least 1.3639 support (Fibonacci extension, double top exit potential, horizontal pullback support). RSI (34) has made a bearish exit from its long-term ascending support-turn-resistance line signaling that we should be seeing a change in momentum to bearish on GBPUSD. Sell below 1.3991. Stop loss at 1.4166. Take profit at 1.3639.


Read more: https://www.instaforex.com/forex_analysis/109387
]Best Regards,
PR Manager
InstaForex Companies Group
http://www.instaforex.com[/b]
My Webpage
 

Offline Instaforexbuk

  • Sr. Member
  • ****
  • Posts: 436
  • Karma: +0/-0
Re: InstaForex - instaforex.com
« Reply #239 on: February 13, 2018, 10:26:57 AM »
Fundamental Analysis of GBP/USD for February 13, 2018

GBP/USD has recently broken the support area of 1.3850-1.3950 which has turned as a resistance area now. The market flow has been quite slow and corrective after breaking below the support and is expected to proceed lower in the coming days. GBP having unchanged after Official Bank Rates and Hawkish Bank of England statement failed to gain the momentum it needed to counter against the impulsive bearish move in the pair recently. Today, GBP CPI report is going to be published which is expected to decrease to 2.9% from the previous value of 3.0%, PPI Input is expected to increase to 0.7% from the previous value of 0.1%, RPI report is expected to show an unchanged value of 4.1%, Core CPI is expected to increase to 2.6% from the previous value of 2.5%, HPI report is expected to decrease to 4.9% from the previous value of 5.1%, and PPI Output is also expected to decrease to 0.2% from the previous value of 0.4%. The economic reports are expected to have mixed outcome which is expected to lead to further correction and volatility in the market ahead of the high influencing economic reports of USD to be published this week. On the other hand, today, USD NFIB Small Business Index report is going to be published which is expected to increase to 106.2 from the previous figure of 104.9, and FOMC Member Mester is going to speak about the monetary policies and the upcoming interest rate decision which is more likely to have an increase on March 2018. As of the current scenario, USD is expected to be the dominant currency in the pair having GBP struggling with the mixed economic reports and market sentiment not favoring the GBP gains despite having positive economic reports and events recently. Now let us look at the technical view. The price is currently residing at the edge of the 1.3850-1.3950 resistance area from where the price is expected to proceed lower towards the 1.36 support area. The price is being held by the dynamic level of 20 EMA as well which also increased the probability of the upcoming bearish pressure in the pair. As the price remains below the 1.3850-1.3950 resistance area, the bearish bias is expected to continue further.


Read more: https://www.instaforex.com/forex_analysis/109607
]Best Regards,
PR Manager
InstaForex Companies Group
http://www.instaforex.com[/b]
My Webpage


Company News from instaforex

Started by Instaforexbuk

Replies: 48
Views: 144709
Last post October 31, 2018, 03:22:55 PM
by Instaforexbuk